02. Frequency in Images
Frequency in images
We have an intuition of what frequency means when it comes to sound. High-frequency is a high pitched noise, like a bird chirp or violin. And low frequency sounds are low pitch, like a deep voice or a bass drum. For sound, frequency actually refers to how fast a sound wave is oscillating; oscillations are usually measured in cycles/s (Hz), and high pitches and made by high-frequency waves. Examples of low and high-frequency sound waves are pictured below. On the y-axis is amplitude, which is a measure of sound pressure that corresponds to the perceived loudness of a sound and on the x-axis is time.
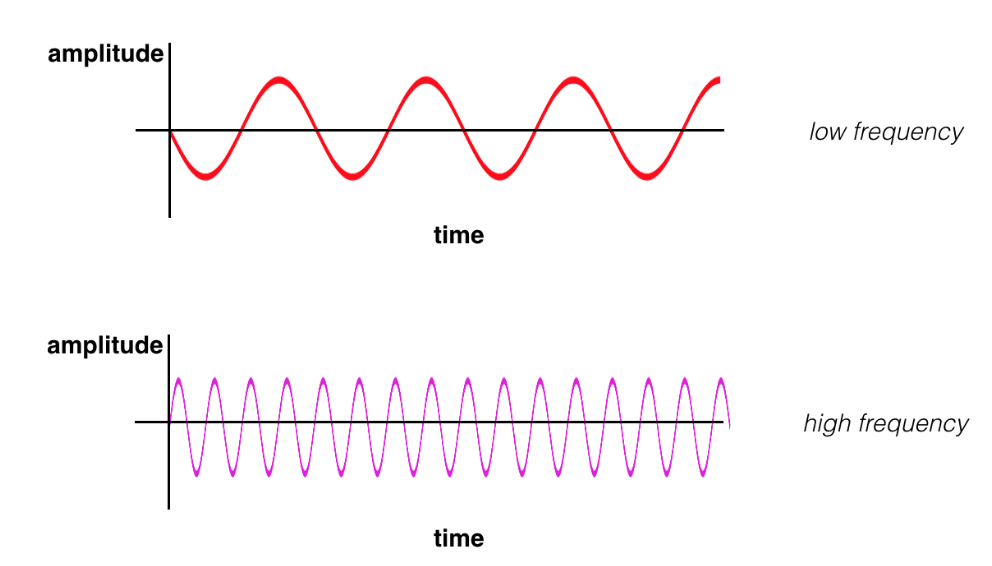
(Top image) a low frequency sound wave (bottom) a high frequency sound wave.
High and low frequency
Similarly, frequency in images is a rate of change. But, what does it means for an image to change? Well, images change in space, and a high frequency image is one where the intensity changes a lot. And the level of brightness changes quickly from one pixel to the next. A low frequency image may be one that is relatively uniform in brightness or changes very slowly. This is easiest to see in an example.
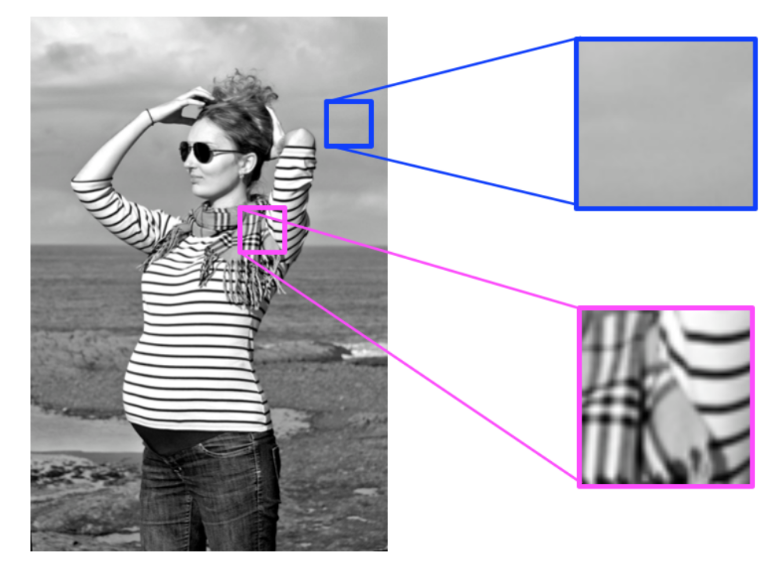
High and low frequency image patterns.
Most images have both high-frequency and low-frequency components. In the image above, on the scarf and striped shirt, we have a high-frequency image pattern; this part changes very rapidly from one brightness to another. Higher up in this same image, we see parts of the sky and background that change very gradually, which is considered a smooth, low-frequency pattern.
High-frequency components also correspond to the edges of objects in images, which can help us classify those objects.
Fourier Transform
The Fourier Transform (FT) is an important image processing tool which is used to decompose an image into its frequency components. The output of an FT represents the image in the frequency domain, while the input image is the spatial domain (x, y) equivalent. In the frequency domain image, each point represents a particular frequency contained in the spatial domain image. So, for images with a lot of high-frequency components (edges, corners, and stripes), there will be a number of points in the frequency domain at high frequency values.
Take a look at how FT's are done with OpenCV, here.
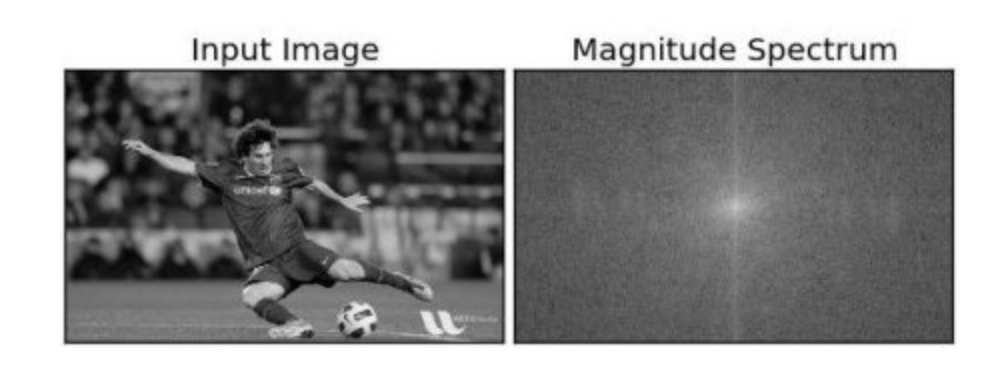
An image of a soccer player and the corresponding frequency domain image (right). The concentrated points in the center of the frequency domain image mean that this image has a lot of low frequency (smooth background) components.
This decomposition is particularly interesting in the context of bandpass filters, which can isolate a certain range of frequencies and mask an image according to a low and high frequency threshold.